
Listening to Iridium Satellites with a €35 Dongle 📡
So this started, as most things do, with a completely reasonable question: what's floating around in the radio spectrum above 1.6 GHz? Turns out quite a lot, and some of it is surprisingly readable with hardware that costs less than a decent lunch.
Iridium is a constellation of 66 active satellites in low Earth orbit that provides global satellite phone and data coverage. You've probably seen the chunky handsets or heard of the inReach devices for hiking. What you probably didn't know is that the downlink signals (the ones the satellites blast continuously at the ground) are unencrypted enough that a cheap RTL-SDR dongle and some open-source software can decode them in real time. Not the content of phone calls (those are encrypted), but the network management frames: which satellite is overhead, which channels are available, handoff events, channel assignments, paging activity. The constellation's nervous system, essentially, just sitting there in the air for anyone to look at. 🤷♂️
The Hardware 🔧
RTL-SDR NooElec Nano 3
The humble USB dongle. About €25. Samples at 2 MSps and covers a wide enough frequency range to hit the Iridium L-band at 1616–1626.5 MHz. Not the best SDR in existence but perfectly adequate for this job, and honestly better than the HackRF One I also own because its noise figure at L-band is lower. Sometimes cheaper wins.
NooElec SAWbird+ Iridium LNA
This is the piece that makes the difference. A SAW (Surface Acoustic Wave) bandpass filter centred on the Iridium band plus a low-noise amplifier on one board. Powers from bias tee, so the dongle supplies the ~4.5V DC through the coax. Without this, you get frames. With it, you get a lot more frames. Goes between the antenna and the dongle.
NooElec L-band patch antenna
A passive patch antenna designed for 1525-1660 MHz. Directional, circularly polarised, which matches what the satellites emit. Pointing it at the sky and leaving it flat works reasonably well. An omnidirectional "donut" antenna actually outperforms it for passive total-sky coverage, but the patch is tidier to mount and with the LNA in the chain the link budget is fine.
The whole chain is: Antenna → LNA (bias tee powered) → NooElec Nano 3 → Mac. (Make sure the LNA is enabled in the soapy config by adding biastee = true).
The Software Pipeline 🖥️
Three main pieces, all open source:
gr-iridium does the heavy lifting. It takes the raw IQ samples from the SDR, runs an FFT burst detector to spot Iridium bursts in the spectrum, downmixes each burst, runs carrier and timing recovery, demodulates the QPSK symbols, and outputs decoded bit frames. Running it with -D 4 uses four parallel demodulator workers which helps throughput.
iridium-parser.py takes the bit frames and decodes the protocol: BCH error correction, unique word detection, frame type identification. Outputs human-readable lines like IBC:, IRI:, IDA:, ISY: with all the fields parsed.
reassembler.py goes a level higher and reassembles multi-frame messages into complete things: paging messages, ACARS aviation data, short burst data. You pick a mode (-m page, -m msg, -m acars) and pipe the parser output into it.
The live pipeline looks like this:
iridium-extractor -D 4 -d 14 iridium_rtlsdr.conf 2>extractor.log \
  | python3 -u iridium-parser.py --uw-ec --harder - 2>/dev/null \
  | grep --line-buffered -v "^RAW:" \
  | tee frames_$(date +%Y%m%d_%H%M%S).txt
The --uw-ec and --harder flags push the parser to try harder to recover marginal frames. The tee saves everything to a timestamped file while still printing to the console.
A typical decoded IBC frame looks like:
IBC: p-1165880-e000 000019821.2107 1622059272 92% -41.10|-096.55|15.14 131 DL
     bc:0 sat:079 cell:07 slot:1 sv_blkn:0 aq_cl:1111111111111111
     aq_sb:19 aq_ch:2 time:2026-06-22T18:20:44.81Z
That's satellite 79 overhead, 15 dB SNR, broadcasting GPS-synced network time and telling any Iridium terminal in range to use acquisition channel 2 in subband 19 if it wants to connect. The aq_cl:1111111111111111 means all 16 acquisition channels are open. The satellite is actively serving traffic.
You also see uplink frames. Which means a terminal nearby was transmitting. The satellite is 780 km up, and the ground-level signal from someone's Iridium terminal (e.g. inReach and such) a few hundred meters away leaks into the antenna. Near-field capture. Slightly surreal. 👀
The sat: Number is Not What You Think
Every decoded frame carries a sat: field, a number between 0 and 127. It's tempting to treat this as the satellite's identity, but it isn't. It's an Iridium network-internal identifier used to designate logical roles in the constellation: cells, spot beams, time slots. The physical satellite that broadcasted the frame does not expose its "real" identity in this field, and there's no published mapping between the internal 0--127 numbering and the TLE catalog names (IRIDIUM 100, IRIDIUM 133, etc.) that the outside world uses to track them.
This matters for the visualiser. To figure out where a frame was coming from, the position extraction script ignores the sat:field entirely and instead asks: at this timestamp, which of the 80 Iridium NEXT satellites was at the highest elevation above my location? That satellite gets credit for the frame, regardless of what network ID is printed in the decoded output.
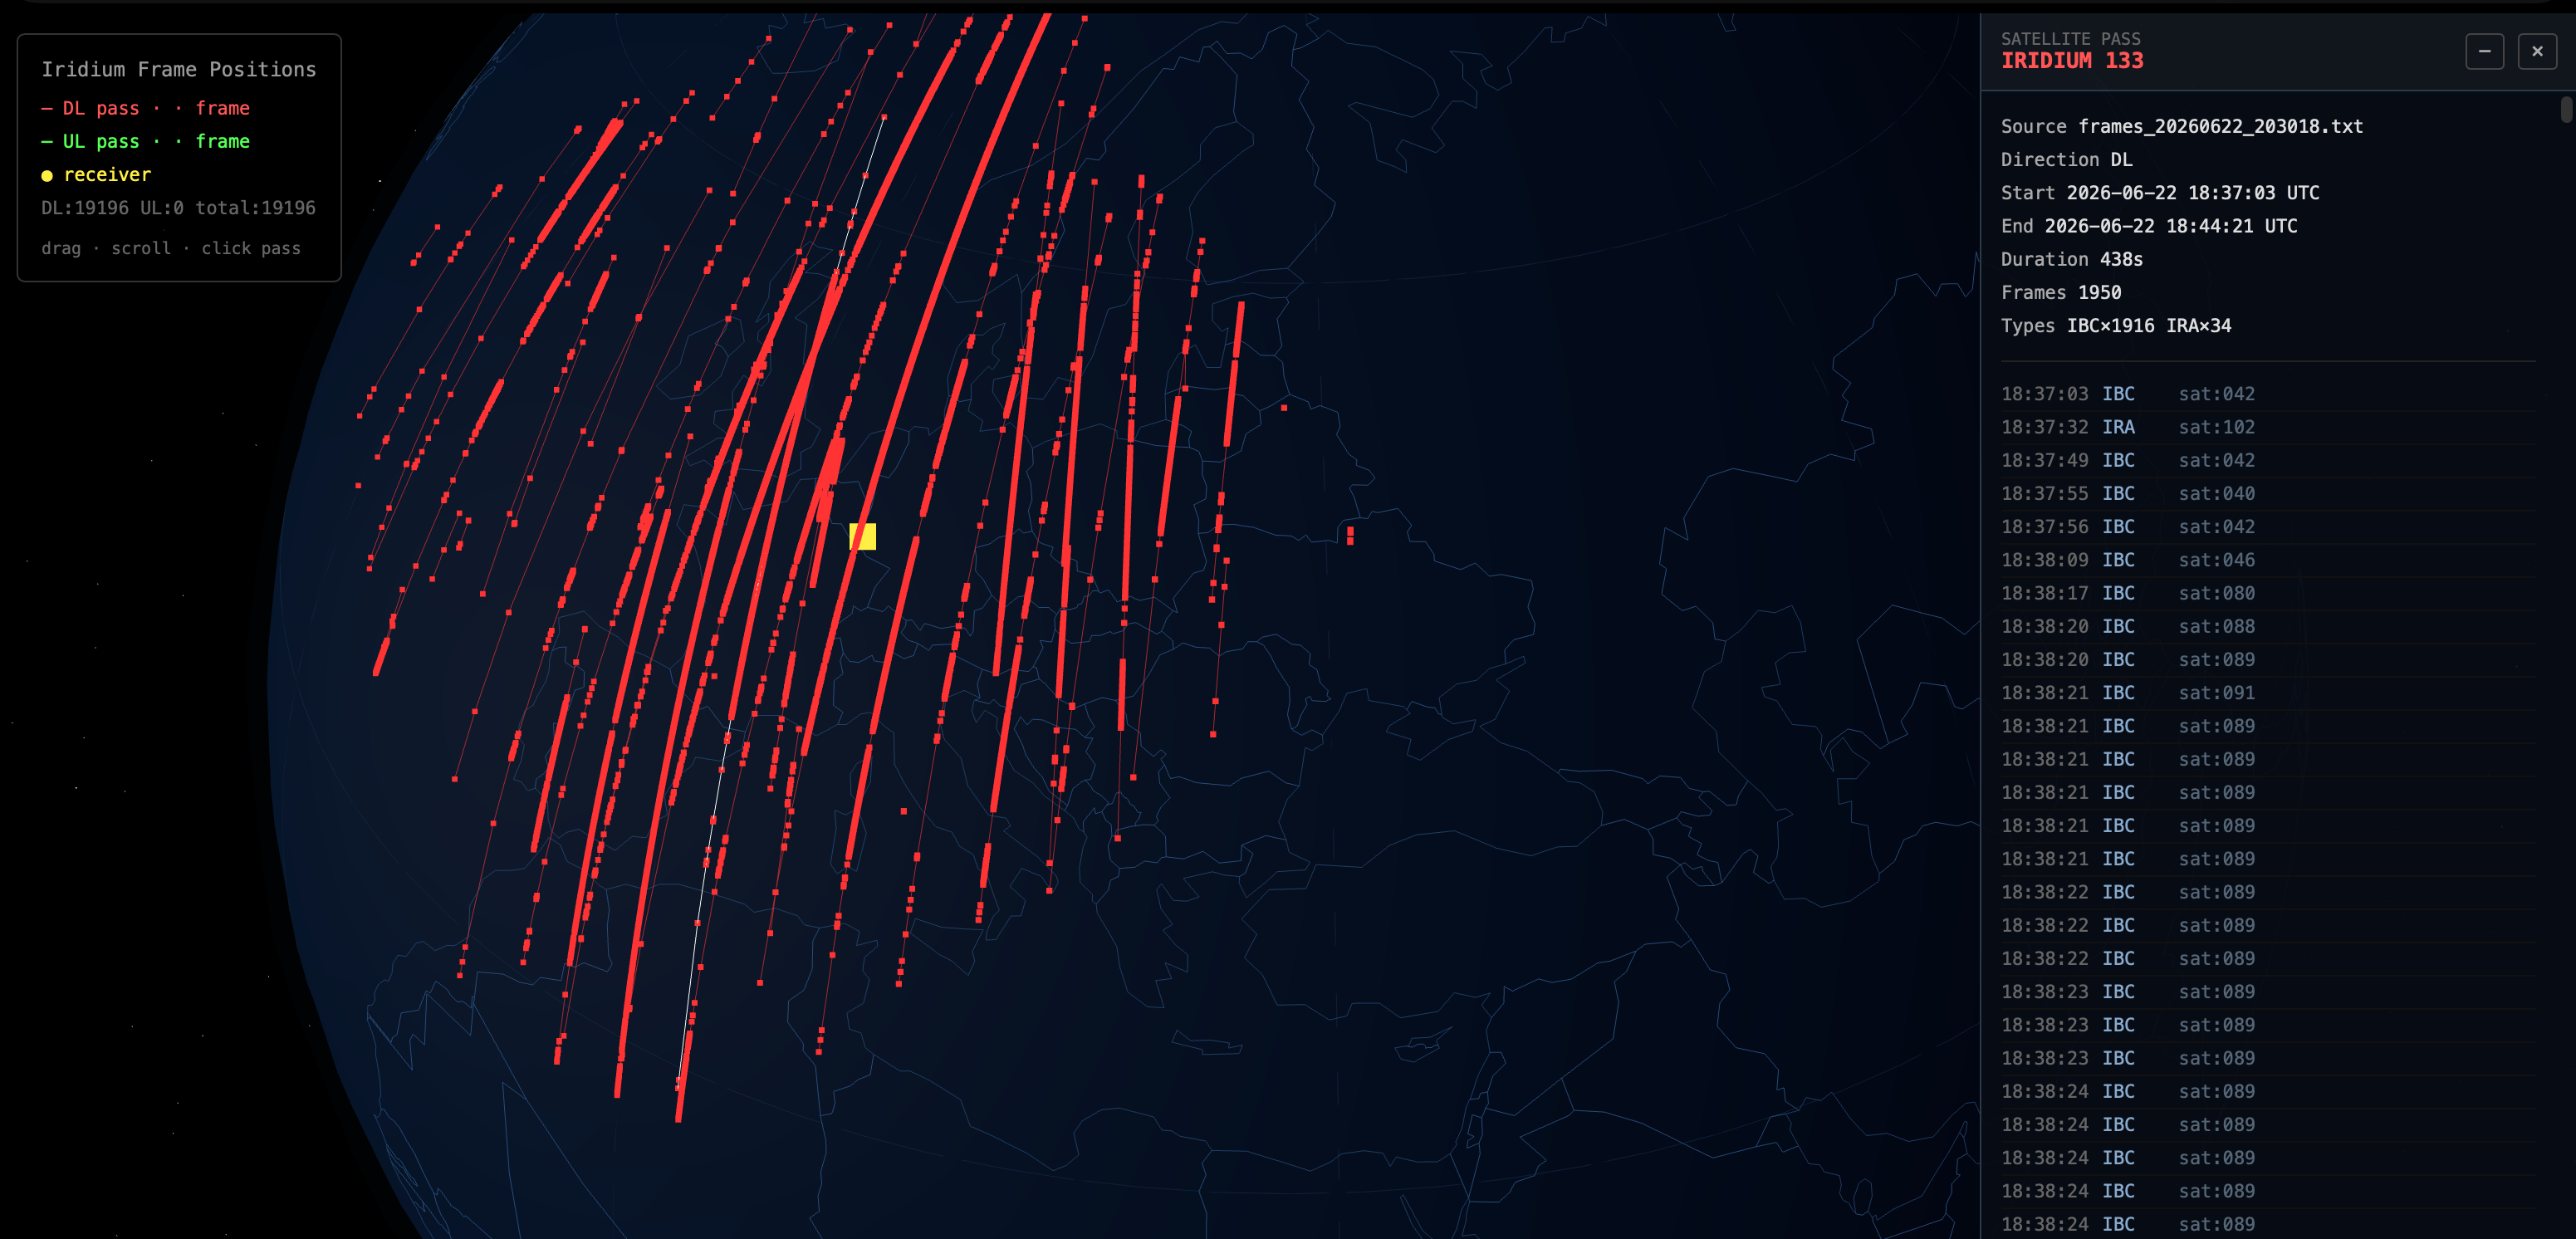
It also explains why a single pass in the viewer can contain frames with a dozen different sat: numbers. During a typical 7-minute overpass you're within earshot of several satellites simultaneously, their spot beams overlapping on the ground. The antenna picks up IBC broadcasts from all of them at once. The one at the highest elevation is the dominant signal, but adjacent satellites at lower angles are audible too. A burst of sat:089 frames concentrated at the peak of a pass is almost certainly from the physical satellite directly overhead, while the scattered sat:046, sat:063, sat:127 entries mixed in are side captures from neighbours at shallower angles. But they all get grouped under the TLE name of whichever physical satellite was highest at that moment, because that's the best attribution we can do without a definitive ID-to-TLE table.
Visualising The Passes 🌍
After logging frames for a while I wrote a small Python script that:
- Parses the saved frame file
- Downloads current Iridium NEXT TLEs from Celestrak
- Uses skyfield to compute which satellite was at highest elevation above my location at each frame's timestamp
- Outputs a
positions.jsonwith lat/lon/alt for every decoded frame
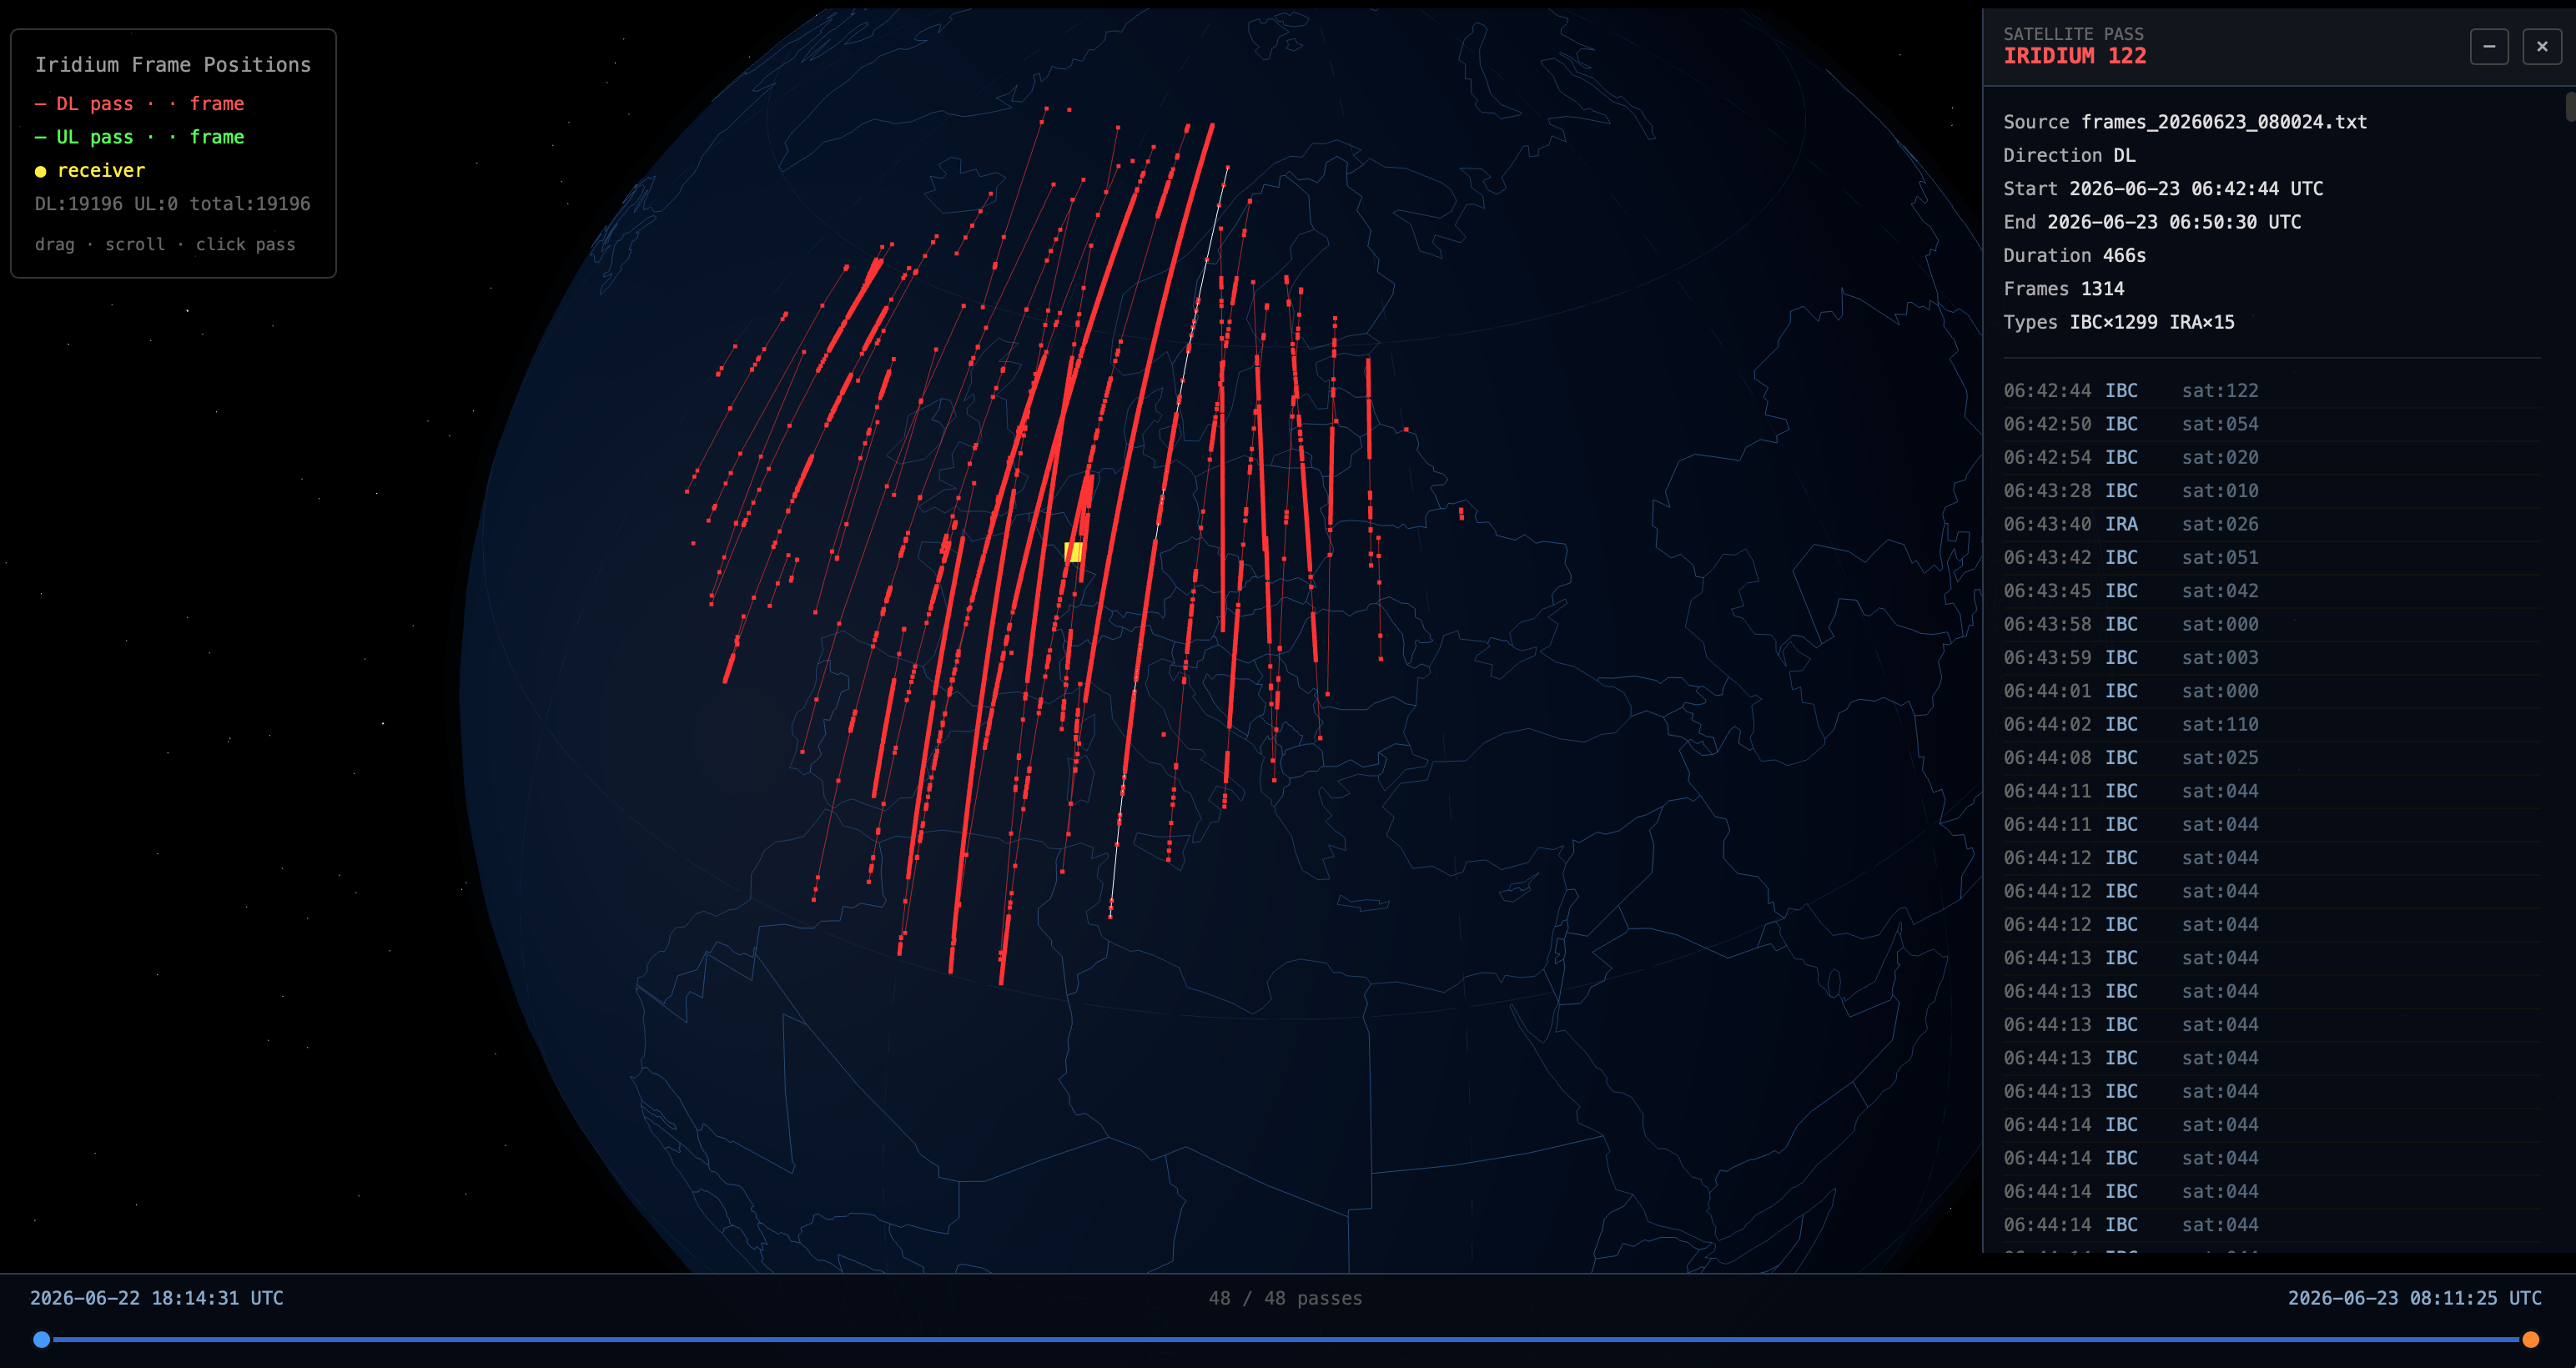
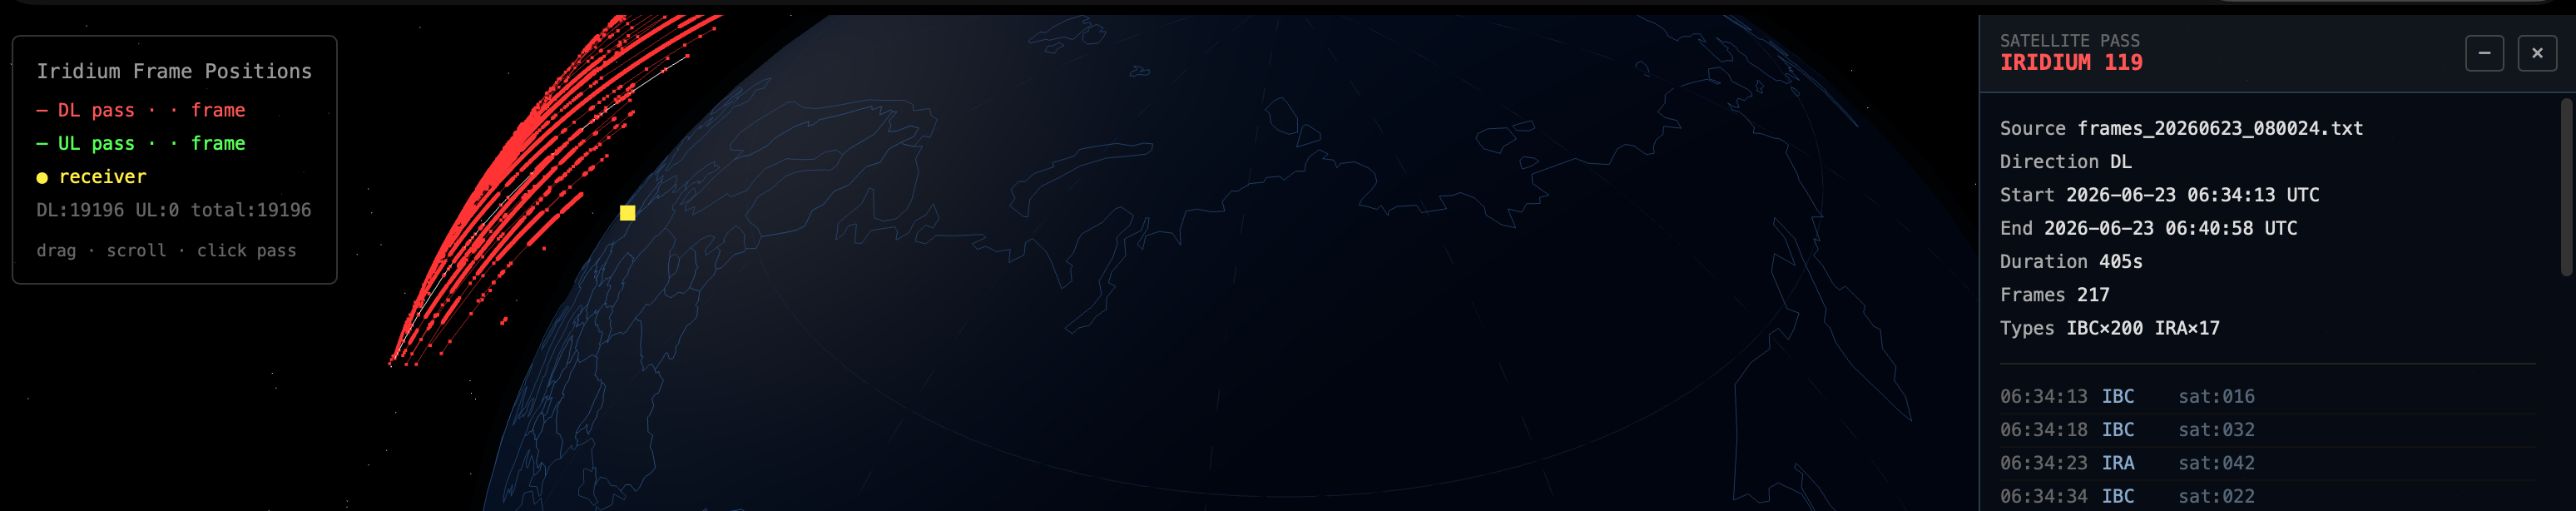
Then a Three.js viewer renders it on an interactive globe: red streaks for downlink passes (satellite position in orbit, above the surface), green dots for uplink frames (sub-satellite ground point), a yellow dot for the receiver, country outlines from Natural Earth data. Click a pass line and a side panel slides in showing the satellite name, timing, duration, and a scrollable list of every frame in that pass.
Try it here: https://halfdonebutinthemaking.github.io/iridium-satellite-tracker/viewer.html
It's a surprisingly satisfying way to see what the antenna actually captured. 🎉
Why Does It Form a Hexagon? ⬡
This was the unexpected bit. After a few hours of logging I expected the coverage area to look like a rough oval or circle centred on my location. Instead the pass tracks formed a regular six-sided polygon.
It makes complete sense once you think about the constellation geometry. Iridium NEXT has 6 orbital planes, each spaced exactly 60° apart. All are near-polar orbits at 86.4° inclination. So every pass over central Europe runs almost due north to south. From a fixed receiver, each orbital plane transits as a separate north-south streak at a different longitude offset, spaced regularly because the planes themselves are regularly spaced. Six planes, six streaks, six edges when you connect the horizon entry and exit points, which is a hexagon. The full geometric fingerprint of the constellation, visible from a single point on the ground.
There is a subtlety though. At 86.4° inclination the tracks aren't exactly north-south; they're tilted about 3.6° off vertical. Ascending passes (satellite moving northward) tilt slightly east-of-north; descending passes (moving southward) tilt slightly west-of-north. Those two families lean gently toward each other, which means where tracks from different planes pass close together in longitude, they cross. A sufficiently long capture doesn't just produce a hexagon outline. I guess it produces something closer to a Star of David, with crossing strokes where ascending and descending passes from adjacent planes intersect near the receiver's view window.
The Iridium orbital period is about 100 minutes. A complete set of all six planes transiting takes roughly 10 hours. This is the constellation design made visible from a single point on the ground. I find that genuinely beautiful and slightly mind-bending. 🔺
State Of The Project 🚧
Working, producing real decoded frames, viewer functional. Still half-done in the traditional sense:
- The LNA arrived and is in the chain: decode rate improved noticeably,
- The viewer is usable but lacks any filtering UI or time scrubbing,
- No automated archiving or database yet, only flat text files for now.
The pipeline runs on a Mac with GNURadio 3.10.12, Python 3.12, and uv for environment management. Getting gr-iridium to build required patching the CMakeLists.txt to work around a pybind11 3.x incompatibility, which is the kind of detail that makes this hobby so enriching. 😅
Code for the viewer and extraction scripts is in the project repo if any fellow sufferer wants it.
As always: works on my machine, probably fine, definitely not finished.